On the same day that the story about a levelling of life expectancy (LE) and possible links to austerity hit the press, the Journal of the Royal Society of Medicine published my letter responding to the paper that sparked a flurry of interest in the same topic earlier this year. That paper was entitled “Why has mortality in England and Wales been increasing? An iterative demographic analysis“.
Irritatingly, I have no budget to pay for open-access publication, so although the original paper is freely available, my letter outlining the paper’s errors is not. In addition, as the JRSM does not publish letters as “advance access”, the points I wished to make have been held back for 3 months. This feels pretty unsatisfactory.
One side of the argument is out there and its refutation is not, which is a shame as the paper has some profound flaws – none of which have stopped the authors from quoting the paper as if it were reliable:

In addition to which, the authors’ response to my letter suggests the critique to make little difference to their conclusions. I am not persuaded.
So here is a summary of what is wrong with its analysis.
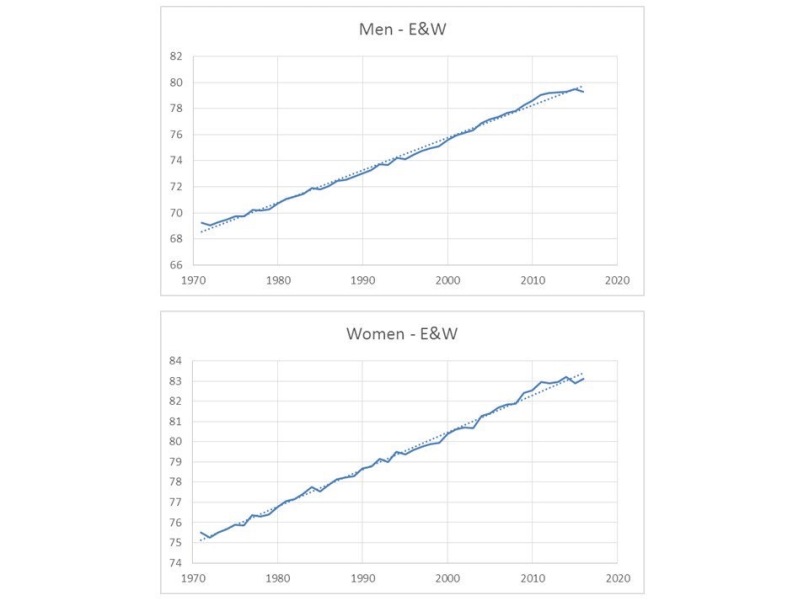
- The paper claims to be an analysis of age-standardised mortality and makes some play of the need for standardisation. But the data it quotes and illustrates are not standardised. Instead, they are crude mortality data both in the text and in figure 1 of the paper. The proportional changes described at the top of the right hand column of text on the 2nd page are of the crude mortality rates. It is not true, as the paper states, that age-standardised rates are higher than at any point since 2008, as they were higher in 2010 – an error also stated in the abstract. Subsequent analysis is manifestly predicated upon this error.
- The methods section does not accurately describe the source or handling of the data. The citations imply the use of standard release data, whereas having run into a brick wall on these, it turns out that the authors used a specific run of data obtained from ONS. How they handled data above the age of 90 is unclear.
- The methods section also omits to mention that the comparison of years used mid-year to mid-year data rather than calendar year. This renders the findings of the paper non-replicable if the described method is followed. The labelling of those data in figure 2 is also incorrect as a consequence – they should indicate 2013-14 and 2014-15. Moreover, this very markedly amplifies the winter excess effect of 2014-15. Excess winter deaths data for 2015-16 are now available and show a fall of the excess rate back to the average of recent years
 It is worth noting here also that the excess of winter deaths in 2014-15 is not unprecedented, but also occurred as similar levels in the 1990s.
 - Taken together, the errors of non-standardised rates and exaggeration of the winter 2014-15 effect in the overall figures renders dubious the claim of a clear change in trajectory of mortality. When the genuinely age-standardised fall to 2014 is considered it looks like this:

It is only when the 2015 data (which include most of the bad winter effect) are added into the trend that it looks to have stalled: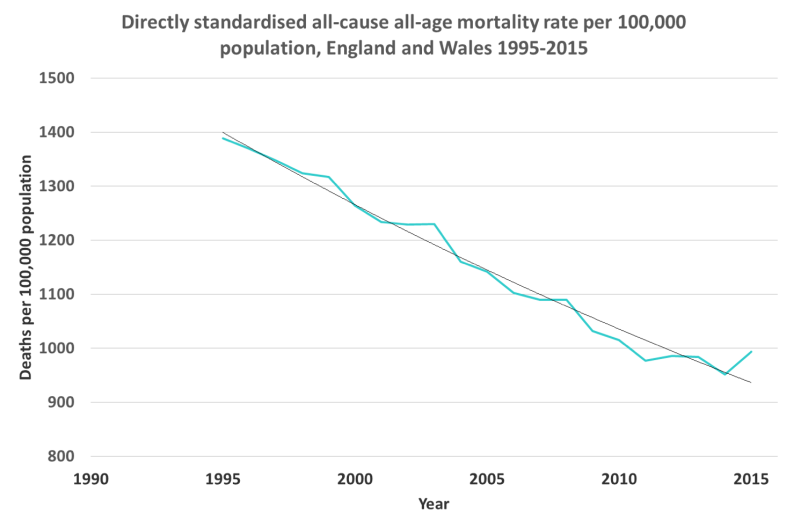
Visually, the up-tick of the graph changes the way we perceive the data quite markedly. - In the last paragraph of page 2 of the paper it is stated that the supposed trend in deaths “cannot be explained by population ageing”. This is a conclusion that could only genuinely be drawn from analysis of the age-standardised figures. But having drawn that conclusion from what are actually crude data, the authors then present the crude excess of deaths by month in figure 3 against a baseline of average deaths in 2006-2014. No explanation is offered for the curious choice of a 9-year baseline. The annual excess of deaths over the crude average for that period of 9 years is 30,515. However, these should be compared with standardised figures. In fact, the excess age-standardised rate in 2015 when compared with 2006-2014 is -32 per 100,000, which would be equivalent to -18,331 deaths if applied to the mid-year population estimate for that year. Either way, this is an essentially arbitrary analysis since there is no logic to use of a 9-year baseline as the comparator. I note also that the paper states in relation to the excess figure of 30,515 that “calculations of excess deaths in this paper vary slightly due to differences in standardisation in various comparisons”. I think the juxtaposition of that number and statement is misleading, since it implies the figure to be standardised when it is not.
Altogether, the errors in the paper are extensive and fundamental to its entire thesis. They seem to me to kill the assertion that there is yet evidence of a real change in mortality trend. What remains is simply the very substantial excess winter deaths figure for 2014-15. The key point is surely to ask whether there is an underlying trend once the noise of winter variation is removed. I do not believe that has been demonstrated in this paper.