St James’ Park or the Rugrado?

I think that you’ll agree that 48,000 is a lot of people. Nearly enough to fill St James’ Park (52,405). A LOT of people, but not as many as 130,000, which would overflow the Camp Nou and could make a substantial crowd even in the interestingly named Rugrado 1st of May Stadium in Pyongyang (150,000).

Just as Shaw said that the English invented cricket to give them some idea of eternity and geography is measured in units the size of Wales, so football crowds are useful in helping picture volumes of people.

So, does it matter if austerity killed a Rugrado’s worth of people from 2012 to 2017 or if it was only the size of Newcastle United’s crowd? Either would be appalling. But perhaps because it is so damning to make either claim, as the Institute for Public Policy Research (IPPR) did in its recent report “Ending the Blame Game: The Case for a New Approach to Public Health and Prevention”, it seems doubly important to be accurate in doing so.

I’m not sure I agree with the premise of the IPPR’s title, though there is plenty in the report with which I concur, both through hard evidence and subjective experience. Yet I can’t get past that headline about deaths, because it is simply wrong.

The report itself makes the 130,000 deaths claim on page 6, but provides no citation or data source, stating simply that the estimate was made on the basis of extrapolating the trend for “deaths attributable to a preventable risk factor” from 1990 to 2012 then subtracting the extrapolated from observed numbers in subsequent years.

The term “deaths attributable to a preventable risk factor” is not a standard definition. It doesn’t even appear as a phrase in a Google search. However, the report’s summary states: “Over half of the disease burden in England is deemed preventable, with one in five deaths attributed to causes that could have been avoided.” This is more familiar. A figure of 1 in 5 is broadly in line with the definition of “mortality from causes considered preventable”, used by Public Health England in its Public Health Profiles. Eurostat explains the concept of amenable and preventable deaths here, pointing out both that these definitions overlap and that around 1.2 million deaths were either preventable or amenable in the EU in 2015, of a total of over 5.2 million – so again, about 1 in 5.

Taking PHEs numbers from its Fingertips website, we can crudely replicate the IPPR’s stated extrapolation – and here I use the word ‘crude’ advisedly, as we are using crude numbers rather than standardising and re-applying rates to population estimates. The trend looks like this:

For clarity and to allow replication, the numbers I have used here are taken from the 3-year rolling data and, rather than use individual year data, I have divided the 3-year aggregates by 3 and plotted them against the central year, thereby smoothing the curves.

I have illustrated both the crude numbers (upper line, left axis) and the rate (lower line, right axis) as this neatly illustrates how the trend of crude deaths has the effect of exaggerating the reversal of preventable decline. The pattern appears in both but is much smaller than crude figures might imply and, in part, reflects the increase in older population projected for this decade.

The dotted line indicates my extrapolation of crude number data for 1990-2012. For both crude and rate data I have taken a linear extrapolation of the preceding 5 years’ data to derive assumed figures for 2017.

Subtracting the extrapolated downward trend from the actual observations (plus that additional point for 2017) yields a total of ‘excess deaths’ of roughly 48,500.

Bearing in mind that crude deaths exaggerate the actual effect because of demographic shift, the true number is necessarily smaller than this, though it is difficult to say by how much. It is probably fair to say that 48,500 is more likely to be the upper end of the range or confidence interval rather than a central estimate.

In summary, I would say that the excess of deaths over trend is real but is unlikely to have totalled more than the capacity of St James’ Park.

Facts matter, and exaggeration undermines the objective force of our arguments. And I hate the fact that by saying “it was fewer than a football stadium’s worth” it makes me sound as if I am playing down just how disgraceful that number actually is. But, as far as I can see, 130,00 is simply wrong, and the IPPR should either explain its reasoning properly or withdraw the claim.

The first UK city to lower child obesity?

One of the great joys of the internet age (and yes, this says much about the geek in me) is that it is now possible to pick up a news story, read the scientific paper upon which it is based and check out the original data before getting out of bed. Which I did this morning on reading about Leeds, the “first UK city to lower its childhood obesity rate” according to the Guardian and many other news outlets. It is a great story. Something we would love to have been able to claim for Newcastle, but we can’t. Sadly, neither can Leeds.

The study, published in Paediatric Obesity, is based upon data readily available in Public Health England’s Fingertips website – in the section on NCMP and Child Obesity Profile, the figures are those for “Reception: Prevalence of obesity (including severe obesity), 5-years data combined”. The study was based upon 4 data points, equivalent to 4 consecutive 5-year rolling averages. For Leeds these showed a fall from 9.42% to 8.83% over the reported period from 2009/10-2013/14 to 2012/13-2016/17.

This prompted much admiration and praise on Twitter, including a Tweet by the Secretary of State, Matt Hancock, saying “Childhood obesity rates have fallen in Leeds after bringing in parenting classes, study shows – highlighting pivotal role parents play in tackling childhood obesity. Terrific step forward we must build on if we’re to protect health of future generations”.

I twitched a little at this narrative of parental choice and responsibility, particularly coming the day after publicity for a much larger study showing a powerful relationship between breastfeeding and obesity.

But what was missing from the news coverage and responses was the fact that there is now a fifth data point in the Fingertips data – for the period 2013/14-2017/18 – and this shows the prevalence of obesity in Leeds to have risen again to 8.98%. This is because the single-year data for the city in 2017/18 showed a rise to a prevalence figure of 9.5% in the reception age group.

OK, you might say, it is still a fall, and possibly a bit more than the national change over the same period. But let’s look at Newcastle’s figures for the same periods. These show that for the time covered by the published study, obesity in Newcastle, by the same measure, fell from 12.10% to 11.25%. And its figure for 2017/18 was 11.16%.

So, between 2009/10 and 2017/18, obesity by this yardstick fell in Leeds by 4.68%, whereas in Newcastle it fell by 7.81%.

Does this make Newcastle the first UK city to lower its obesity rate? Or does it mean that the Leeds data have been misleadingly over-interpreted?

This matters, because, however worthy the parental programme (HENRY) in Leeds may be, this study is not evidence that it works. But it has fuelled the individual, behavioural choice paradigm of childhood obesity, against which there is a mass of evidence, and that strikes me as irresponsible epidemiology.


MUP

In the recent budget, the Chancellor failed to act on the price of alcohol other than cheap ciders, despite a widespread public health consensus that minimum unit pricing would be an effective step. A year ago today, one of our students at Newcastle University died of alcohol poisoning.  A day or so later I received the following note from our press office:


A Daily Mail reporter is writing a feature about bars and pubs who are still selling cheap alcohol offers to young people like students. In light of the 20-year old Newcastle University student, Ed Farmer, who recently died of excessive alcohol consumptionShe knows that most Student Unions have now banned society drinking games and initiations within campus bars. The reporter noticed that pubs like, the Soho Rooms which is part of the Council’s “Raising the Bar” scheme – promoting responsible drinking (holds the silver position). They are currently selling 9-shots of Vodka for £5The reporter wants to know what checks are in place by the local authority for such pubs, who are openly advertising (online) basically saying to people “why not get smashed with us!

  • What line do pubs have to cross for the local authority to say “we won’t renew your licence”?
  • She wants to know what role the council has / our duty to set standards for bars and pubs to adhere to?
  • What preventative measures are put in place by the Council?

For interest, I enclose below the full text of my response:

“We agree completely that vodka, or any other alcoholic drink, being sold at £5 for 9 shots is dangerous and inappropriate. A shot of vodka is equivalent to about 1 unit of alcohol, so a price of £5 for 9 shots is a price per unit of about 56p per unit. This is comfortably higher than the proposed Scottish minimum unit price for alcohol of 50p per unit which has been fought through the courts by the alcohol industry, and reinforces the view that even a rate of 50p per unit would be too low.

“At present the Government has no plans to introduce minimum unit pricing in England despite overwhelming evidence to support its effectiveness as a means of reducing alcohol-related harm – recently supported in a review of evidence by Public Health England.

“The ‘Raising the Bar’ policy is based upon working with businesses in the city to try and promote healthy behaviours and health protection to the greatest extent that we can within the existing law. We consider that it would be irresponsible not to attempt to act in this way, given the restrictions of existing legislation. At present the council is not permitted by law to remove a licence on the basis of the price of alcohol. We are, however, working to  strengthen our collaborative approach to health protection which extends beyond alcohol to cover action on other areas of personal risk, and of sexual health in particular – review of each business’s status will consider its adherence to good practice.

“Newcastle City Council welcomes the Daily Mail’s support for minimum unit pricing and the power for local authorities to enforce this as part of its approach to protecting the health of the public.”

Here is the article as it finally appeared, and which (surprise!) doesn’t follow through on the logic of the Mail’s questions.

I offer my deepest sympathy to the Farmer family – I, too, have had a young, close relative die of alcohol poisoning – we will not forget, and we will not stop arguing for public policy that prioritises wellbeing and health over profit.

120,000 deaths revisited…

Although intending to move on from this topic, a couple of things seem worth updating.

The first of these is a likely explanation for the discrepancy in the scale of age-standardised values in the Watkins paper, noted in my previous blog. I am grateful to colleagues at Public Health England for suggesting the possibility that the authors have mistakenly used the 1976 European Standard Population (ESP) rather than the current, 2013 revision.  This looks plausible, although the difference is surprisingly large. Here is a useful Scottish paper on the change between those versions of the ESP. The newer version reflects more aged populations, shifting the shape of the population pyramid to reflect the changes of recent decades.

Slide2

It is difficult to be sure what this does to the rest of the calculations in the paper, but it does not resolve any of the other major problems – for example, that it cannot demonstrate causation, or that it uses an essentially arbitrary selection of data points upon which to base its extrapolations.

Secondly, and for fun, it is worth looking at another major change in social policy associated with a change in the trajectory of life expectancy / mortality from an earlier period.

The NHS commenced on 5th July 1948, with (according to Rudolf Klein’s The Politics of the NHS) a clear expectation that the universal healthcare would improve health and render itself progressively cheaper. We are still waiting for this to happen, and its naïveté survives in the Five Year Forward View‘s perspective on prevention. Here is the graph of life expectancy, based upon data in the Human Mortality Database, for the UK from 1941 to 1951:

Slide1It beggars belief that the arrival of the NHS had a negative effect on health, wellbeing and life expectancy. I don’t believe it and neither, I would guess, do you. On the other hand, this illustrates a key message about the relationship between the provision of care and mortality – it has far less effect than most people, including Watkins et al, think.

In their paper, the factors incorporated as potential mediators of an effect are numbers of doctors, nurses, social care staff and so on (see their supplementary file 3, tables S8-S10), so they are clearly suggesting such provision is causal. Their projection to 2020 implies a shortfall against the otherwise projected increase in life expectancy of about 26% – that is, they suggest it will rise by 1.86 years instead of 2.53 years between 2010 and 2020.

Subjective estimates of the contribution of health care to long term falls in mortality are probably swayed by the triumphs – leukaemia in childhood, for example – and regular press coverage of ‘breakthroughs’. An American study in 2014 demonstrated a public perception that 80% of increased life expectancy was attributable to medical care.

Objective estimates put that figure at less than 20%. Life expectancy rose in the UK by about 30 years during the 20th century, with about 6 of those being the cumulative and acute effects of health care. It is possible, of course, that health care has become more effective in recent years though, again, that is a more marginal effect than most imagine.

Which leads us back to the question of “120,000 deaths” and its plausibility. If the shortfall in funding were to cut 26% from the rate of increase, as proposed, then that would be a larger effect on the trajectory of life expectancy than the entirety of health care impact seen over the last century. It is implausible that so relatively marginal (and I use those words with caution as it is not a small amount of money) an effect on funding could produce so major an impact upon mortality.

Big claims need powerful evidence.

As a final note, while writing this I am also following the Twitter feed of the Lancet Public Health Science Conference (#phsci), it seems apposite to flag the conclusions drawn on complexity by my colleague Harry Rutter at the same conference last year, thus:

  • don’t treat complex systems as simple: of course many things appear not to ‘work’; we’re judging them on the wrong criteria;
  • linear cause and effect is (relatively) easy to look for, but that doesn’t mean it’s helpful to do so;
  • Whole systems approach requires a shift from reductionist, linear, single prespective thinking to transdisciplinary, non-linear systems thinking;
  • Don’t forget the lessons of Rose: population level prevention involves shifting the population curve in ways that may be indiscernable at individual level;
  • Conceptualise actions as driving perturbations within systems, not as hammers applied to nails;
  • Move from ‘does it work’ to ‘does it contribute?’

With some small tweaks, these lessons could usefully have been applied in this case.

Why the “120,000 deaths” claim is unsupportable

The press has been full of a new paper in BMJ Open which claims that austerity has been killing people in their thousands. The independent called it a ‘landmark study’ and UCL trumpeted its findings.

Unfortunately, this paper – in common with the earlier paper by Hiam et al. – is fatally flawed (see here for a description of problems with that paper).

Its dishonesty starts in its title – “Effects [my emphasis] of health and social care spending on mortality in England: a time trend analysis”. This explicitly lays claim to causation, which an observational study of this kind cannot do. The title alone should not have been allowed through peer review.

But it gets much worse. Here is fig 1 of the Watkins paper:

Watkins fig 1

The legend reads thus:

Figure 1 Time trend projections of age-standardised death rate (ASDR) per 100 000 individuals. ASDR (left hand y-axis) and the difference in the number of deaths between actual and predicted mortality (right hand y-axis) per year from 2001 to 2014 are shown. The black and blue lines represent actual ASDR for the 2001–2010 and 2011–2014 periods, respectively. The red line represents predicted ASDR using 2001–2010 as an observation base while the 95% CIs are denoted by the beige-coloured area. The grey bars denote the differences between the number of deaths observed and the number predicted for 2011–2014 where positive values correspond to excess deaths and negative values represent lower than expected deaths. Error bars represent 95% CIs. *p<0.05; **p<0.01; ***p<0.001.

Notice firstly that the illustrated data are not 2001-2014 but actually 2002-2014. This may have a small effect in changing the gradient of the projected curve, but I point it out mostly because it is sloppy, which I find worrying in the core of an argument.

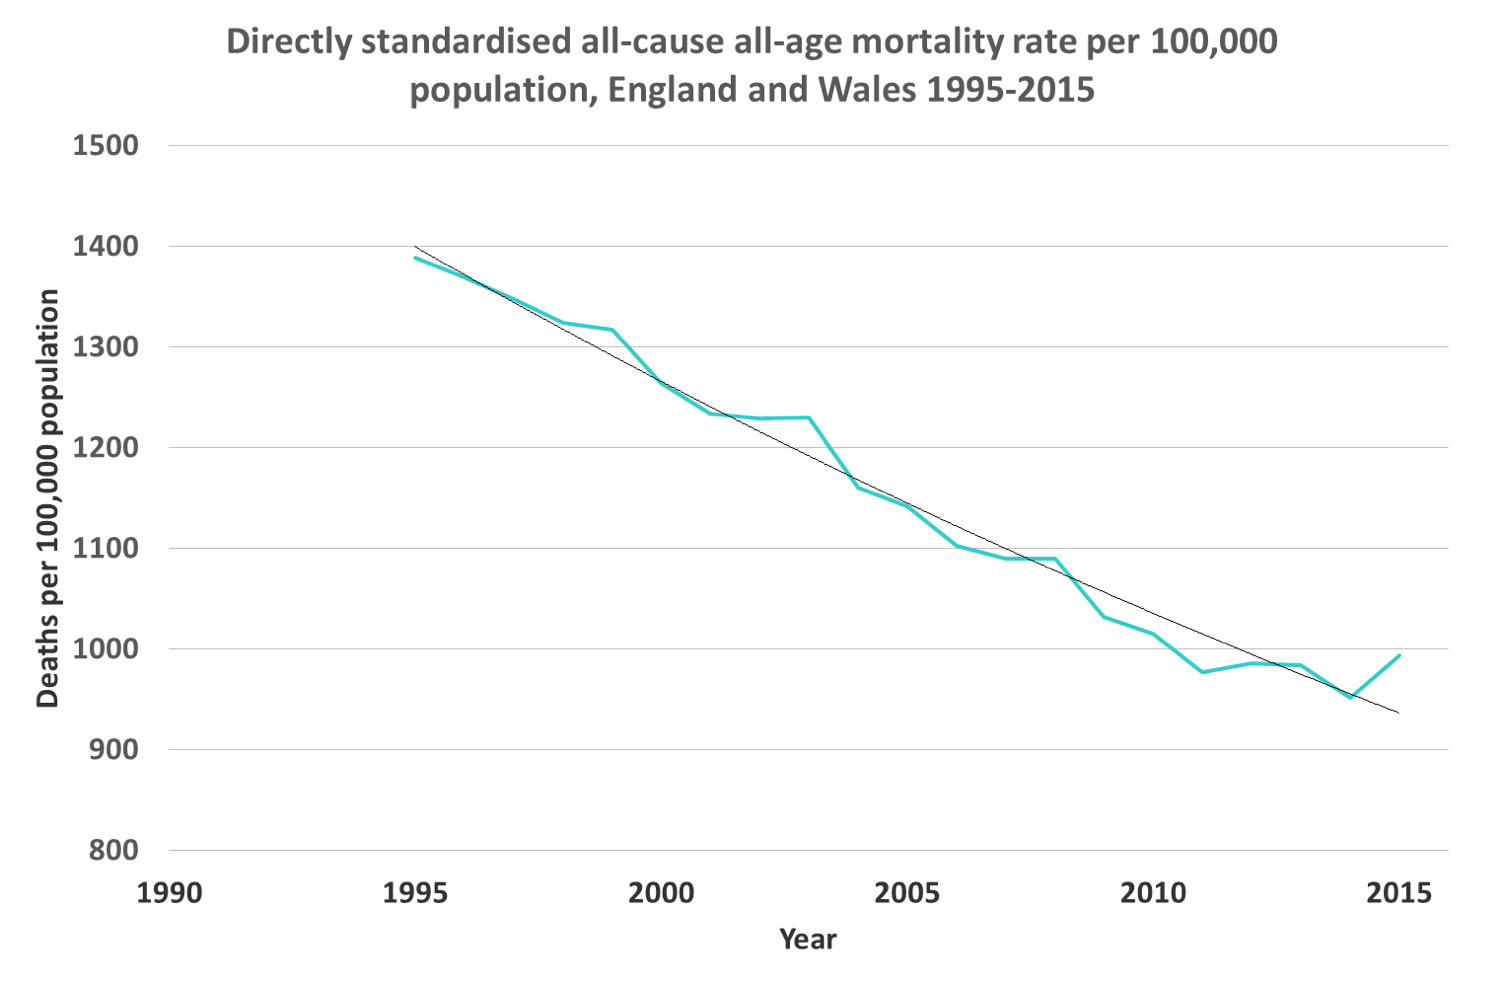
Note secondly, and more importantly, that the mortality rate illustrated falls from 650 per 100,000 to about 500 per 100,000* over this period. Below is a graph of directly standardised all-cause, all-age mortality per 100,000 population for England for 1995 to 2014. This is taken from data you can check in this download of official statistics:

Mortality

The rates for 2002 and 2014 here are, respectively, 1,225 and 947 per 100,000 population. I have no idea how these figures can be reconciled with those quoted in the paper other than to guess that the authors have got their calculations wrong. Which, in turn, throws into doubt all of the other figures in the paper.

Moreover, as can be seen in the longer timescale of my graph, the downward trend of mortality over time does not necessarily suggest a unique slowing of decline since 2010. The overall picture is plausibly one of noise around a continuing fall. One might have made as good a case for a pause in mortality in 2001-2003.

2010 itself was below the trend line, as was 2011, while 2013 and 2014 lay above it. In combination, these would largely cancel one another out. The pattern described by Watkins et al arises only by selective use of segments of the overall mortality curve.

Extension to 2015 data would illustrate a significant kick upwards – but as discussed elsewhere, that can be explained as a winter effect (itself similar to winter excesses seen at other times in the last couple of decades).

None of this means that austerity is not a huge problem for health and social care. It is. We can see that in child poverty statistics, use of food banks, stress and mental health problems relating to implementation of Universal Credit and so on. But the claim that mortality data shows an excess of deaths relating to funding cuts is unsustainable.


*Note: this figure was corrected from 530 on 21st November 2017.

The flawed concept of ‘heart age’

Age is a curious, ill-defined thing even among those who study the subject for a living. In its most pragmatic form, it is ‘chronological’ – a useful tautology, as if age could be marked truly by anything other than the passage of time.

My grandfather, frustratingly to a 4 year old, would reply when asked his age “as old as my eyes and a little older than my teeth”; though typically of his generation in later years he became quite a lot older than his teeth.

The real problem arises when people start talking about ‘biological’ age, as if that were something real and definable, which they then try to define, through telomere length, or frailty indices, collagen cross-linkage and any number of other measures.

Particularly problematic in defining ‘biological age’ is the circular confusion of age-related and age-specific – or if you prefer, age-consequent – disease; that is, the confusion of disease that is more likely to be present because of the cumulative experience of insults and disease which arises because of some theoretical, intrinsic process of ageing. Do you become ill because you are old or old because you are ill? The truth clearly lies somewhere between the two, but the manifest variability of the latter element tempts us into an assumption that it operates exclusively. Particularly in America.

Public Health England are re-promoting their ‘Heart Age’ test, which purports to tell you how old your heart is, relative to your chronological age. It has good intentions. It remains to be seen whether those good intentions have any effect. But I find it profoundly flawed theoretically.

To make real sense, it would be necessary that a heart has a basic trajectory of wearing out. I am not sure how one would measure this, but let’s suppose that it might be by an increasing liklihood of arrhythmia, or of muscle diminution and weakness, or of diminishing patency of the blood vessels. The trouble is that there is no great evidence for this. Instead the increasing probability of a dysfunctional heart in our society is largely a consequence of disease – which itself may be entirely avoidable.

This is not to say that there are not also underlying age-specific processes. Increasing stiffness of blood vessels, for example, could be determined by physico-chemical changes in non-renewable parts of their structure, similar to the racemisation and cross-linkage of proteins in the lens of the eye, which varies to a degree with UV exposure and so on, but explains why we all need reading glasses by about the same age. Importantly, the latter is not a disease. You can’t avoid it. It is a consequence of living for a sufficient period of time with a body of this particular design.

Hearts are different. Most of the heart ‘age’ risk in PHE’s calculations is Coronary Heart Disease (CHD) – which is, to coin a phrase, what it says on the tin: a disease. It isn’t ageing. It may be ubiquitous but it is not universal. There is no ‘natural’ level of CHD for an 80 year old, merely that which is typical of an 80 year old in our society at this particular time. And therein lies the problem with PHE’s concept of ‘Heart Age’. To say I have a Heart Age of 57 implies only that I am typical of men aged 57 with my behaviour and physical characteristics right now – or, more accurately, a little while ago – in the mortality figures. My heart by this measure is only averagely crap.

For fun (admittedly not very much) I changed some things around to try and make my Heart Age younger. This turns out to be pretty difficult to achieve, and even varying it downward by 3 years only increased my predicted event-free survival by a year.

On the other hand, cardiovascular risk is falling at a spectacular rate. If it carried on falling in the next two decades as it has the past two, the actual level of risk would be a fraction of that predicted here. As far as I can see, this isn’t taken into account in the calculator, which is based upon QRISK, which, in turn, is adjusted at intervals for the changing population profile of risk. Indeed, QRISK became necessary because the Framingham equations proved to be not only non-exportable to other populations but to become less accurate with time and inappropriate to other cultures.

All of this renders the whole concept a bit of a gimmick. A different way to tell people to quit smoking, lose some weight and take more exercise. These are excellent messages that we need to continue communicating and facilitating.

But if I told someone of 55 they had a Heart Age of 65, I would feel that I was making up a story to manipulate them, and I don’t think we should do that. That’s why we have science.


Misinterpreting mortality

On the same day that the story about a levelling of life expectancy (LE) and possible links to austerity hit the press, the Journal of the Royal Society of Medicine published my letter responding to the paper that sparked a flurry of interest in the same topic earlier this year. That paper was entitled “Why has mortality in England and Wales been increasing? An iterative demographic analysis“.

Irritatingly, I have no budget to pay for open-access publication, so although the original paper is freely available, my letter outlining the paper’s errors is not. In addition, as the JRSM does not publish letters as “advance access”, the points I wished to make have been held back for 3 months. This feels pretty unsatisfactory.

One side of the argument is out there and its refutation is not, which is a shame as the paper has some profound flaws – none of which have stopped the authors from quoting the paper as if it were reliable:

McKee copy

In addition to which, the authors’ response to my letter suggests the critique to make little difference to their conclusions. I am not persuaded.

So here is a summary of what is wrong with its analysis.

  1. The paper claims to be an analysis of age-standardised mortality and makes some play of the need for standardisation. But the data it quotes and illustrates are not standardised. Instead, they are crude mortality data both in the text and in figure 1 of the paper. The proportional changes described at the top of the right hand column of text on the 2nd page are of the crude mortality rates. It is not true, as the paper states, that age-standardised rates are higher than at any point since 2008, as they were higher in 2010 – an error also stated in the abstract. Subsequent analysis is manifestly predicated upon this error.
  2. The methods section does not accurately describe the source or handling of the data. The citations imply the use of standard release data, whereas having run into a brick wall on these, it turns out that the authors used a specific run of data obtained from ONS. How they handled data above the age of 90 is unclear.
  3. The methods section also omits to mention that the comparison of years used mid-year to mid-year data rather than calendar year. This renders the findings of the paper non-replicable if the described method is followed. The labelling of those data in figure 2 is also incorrect as a consequence – they should indicate 2013-14 and 2014-15. Moreover, this very markedly amplifies the winter excess effect of 2014-15. Excess winter deaths data for 2015-16 are now available and show a fall of the excess rate back to the average of recent yearsPicture1It is worth noting here also that the excess of winter deaths in 2014-15 is not unprecedented, but also occurred as similar levels in the 1990s.
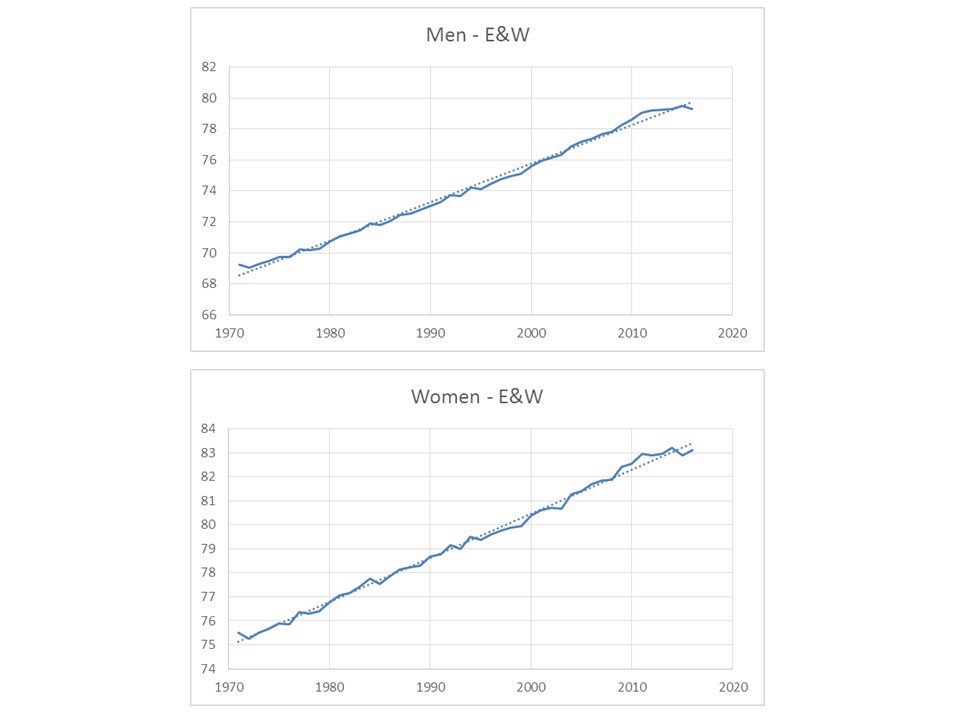
  4. Taken together, the errors of non-standardised rates and exaggeration of the winter 2014-15 effect in the overall figures renders dubious the claim of a clear change in trajectory of mortality. When the genuinely age-standardised fall to 2014 is considered it looks like this:Trend 1
    It is only when the 2015 data (which include most of the bad winter effect) are added into the trend that it looks to have stalled:Trend 2
    Visually, the up-tick of the graph changes the way we perceive the data quite markedly.
  5. In the last paragraph of page 2 of the paper it is stated that the supposed trend in deaths “cannot be explained by population ageing”. This is a conclusion that could only genuinely be drawn from analysis of the age-standardised figures. But having drawn that conclusion from what are actually crude data, the authors then present the crude excess of deaths by month in figure 3 against a baseline of average deaths in 2006-2014. No explanation is offered for the curious choice of a 9-year baseline. The annual excess of deaths over the crude average for that period of 9 years is 30,515. However, these should be compared with standardised figures. In fact, the excess age-standardised rate in 2015 when compared with 2006-2014 is -32 per 100,000, which would be equivalent to -18,331 deaths if applied to the mid-year population estimate for that year. Either way, this is an essentially arbitrary analysis since there is no logic to use of a 9-year baseline as the comparator. I note also that the paper states in relation to the excess figure of 30,515 that “calculations of excess deaths in this paper vary slightly due to differences in standardisation in various comparisons”. I think the juxtaposition of that number and statement is misleading, since it implies the figure to be standardised when it is not.

Altogether, the errors in the paper are extensive and fundamental to its entire thesis. They seem to me to kill the assertion that there is yet evidence of a real change in mortality trend. What remains is simply the very substantial excess winter deaths figure for 2014-15. The key point is surely to ask whether there is an underlying trend once the noise of winter variation is removed. I do not believe that has been demonstrated in this paper.

Life expectancy…

Has it stopped rising? From what I can gather even Michael Marmot only really said that a) its rate of increase had slowed and b) that it was worth investigating whether austerity might be involved. None of which stopped the story being way more extreme on both counts, fuelled in some cases by people who really ought to know better.

So what to think? The first thing to remember is that Life Expectancy (LE) is a fairly artificial construct. It doesn’t actually describe the likely lifespan of anyone, given that it is constructed from contemporary risks – as if a baby born today were to experience today’s age specific risks throughout life. As a result, LE as a measure can change rapidly because of contemporary pressures.

Secondly, the excess winter deaths of 2014-15 make a substantial difference to the calculations and visual appearance of the data. We will only really know what is happening with that trend when we can see if that was a one-off event or something more sinister.

Thirdly, the appearance of slowed increase in LE may be more the result of an upward deviation from trend between 2009 and 2011 rather than a subsequent downward deviation, thus:

DFCJfuRW0AE-CnK
Without those better, earlier figures the furthest right points would not appear anomalous, notwithstanding the 2014-15 excess winter deaths.

This sort of pattern also invites speculation that there is a ‘frail survivor’ effect here, whereby older individuals, having avoided earlier insults, are particularly vulnerable when subsequently exposed to e.g. a new circulating viral strain.

On Radio 4 this morning, the ‘Thought for the Day’ speaker reflected the suggestion that we could be reaching a limit to extension of life expectancy. To which it is worth pointing out that people have been predicting that for many years and have found it necessary repeatedly to revise their assumptions (e.g. see Oeppen J, Vaupel JW. Broken Limits to Life Expectancy. Science (80- ). 2002;296(5570):1029–1031.)


The view from the Acropolis…

Outdoor pollution, worldwide, is estimated to kill 3.7 million people per year. This is not a typo. Combine these with deaths from indoor pollution and the total passes 7 million, or about 1 in 8 of all deaths according to Dr Maria Neira, Director of the WHO Public Health and Environment Department.

As I (EM) write this from an (austerity budget) hotel in Athens, those statistics on pollution-related deaths seem of a piece with the unending torrent of traffic. If the volume were not sufficient to generate a surfeit of particulates, the local style of driving—full speed between the traffic lights then slam on the brakes—surely exacerbates it. This may be of little consequence for me—as a jaywalking Englishman I am unlikely to survive the ‘red lights don’t count if you are turning right rule’ long enough for air quality to matter. But figures published by Public Health England earlier this year suggest around 25 000 English deaths per year are attributable to long-term exposure to particulates.1

So, why Athens?

Because the European and Global Healthy Cities Movement celebrates its 25th anniversary this year, and is meeting to mark the occasion with a conference on ‘Health and the City: Urban living in the twenty first century’. The movement now numbers 99 European cities within its networks, and is moving into its sixth phase with a feeling that city-level action and influence are set to grow yet stronger.

Pollution, traffic, and infrastructure provided the basis for many of the great public health interventions of the past, and there is every reason to believe that they will continue to be defining issues for the health of generations to come. By 2030, more than 70% of the world’s population will live in cities. City health will dominate the fate of the larger part of world population.

The meeting feels revitalized by the growing stature of city leaders and initiatives. Former New York mayor Michael Bloomberg looms large. ‘City health diplomacy’ is a phrase that recurs. Inequalities will not be solved by individual interventions. But they can, and have in the past, been narrowed by the kinds of population-based approaches that are the realm of local government.

In this issue, Gorsky et al. look at lessons from public health in England as it was practiced in the past, growing from the city-based health initiatives of the Victorians.2 Since public health ‘came home’ to Local Authorities in England in April 2013, it is pertinent to consider how its practice will differ not only from almost 40 (wilderness?) years in the NHS, but also how it might echo or depart from the great strides made in the time of Medical Officers of Health. Can modern Directors of Public Health and their colleagues live up to their forebears? Day, Shickle and colleagues propose five talents for public health leadership, and consider the challenges of engaging high-profile champions.3,4These are contributions to a debate that will continue to echo across the globe, since one of the great messages of the Healthy Cities experience is that the local is universal. If a problem exists in Preston, it is likely, in some form, also to exist in Lodz.

Following the news and Twitter feeds from back home during the meeting, the publication of the ‘Five Year Forward View’ leapt to the fore.5 The English National Health Service is currently funded at a level billions of pounds short of that envisaged in 2002 by Wanless in even his most optimistic (‘fully-engaged’) scenario, and Simon Stevens has now staked his claim on future governments to make good at least £8 billion of that shortfall.6,7 Even more significant, we would argue, is the emphasis placed on greater local powers to improve health, with a system-wide shift towards prevention.

While national politicians of all colours examine their fingernails intently and try to ignore the conclusion, obvious to the rest of us, that at some point we need to start talking about raising tax to pay for necessary services, local approaches can go at least some of the way towards amelioration of needs that will grow with demography.

Some aspects of public health are far from new, but others, such as social media, have no real precedent. Amelia Burke-Garcia and Gabriel Scally explore this new world in ‘Trending now: future directions in digital media for the public health sector’, with accompanying commentaries.8–10 We have placed this debate under ‘Wider Determinants’ because the rise of social media is a phenomenon that defies classification as an intervention. We may try to influence its direction but it has an immense and amorphous independence. Gabriel is in Athens, speaking on this and other issues from his long engagement with Healthy Cities. He describes its potential power, for a whole new type of public health engagement, but warns of its double-edged nature, as some of us have already found to our cost.

Finally, we are grateful to Jose Martin Moreno for his reflections on the still unfolding tragedy of Ebola—an avoidable disaster that demands reflection on our collective culpability, and on how, in the words of Denmark’s Crossing Borders ‘a virus turned into a racism outbreak’.11

1          Public Health England Estimating local mortality burdens associated with particulate air pollution, 2014 Chilton Public Health England

2          Gorsky M, Lock K, Hogarth S. Public health and English local government: historical perspectives on the impact of ‘returning home., J Public Health, 2014, vol. 36 (pg. 546-51)

3          Shickle D, et al. Mind the public health leadership gap: the opportunities and challenges of engaging high-profile individuals in the public health agenda, J Public Health, 2014, vol. 36 (pg. 562-7)

4          Day M, et al. Training public health superheroes: five talents for public health leadership, J Public Health, 2014, vol. 36 (pg. 552-61)

5          NHS England Five Year Forward View, 2014

6          Wanless D., Securing our future health: taking a long-term view, 2002 London HM Treasury

7          Wanless D., Securing good health for the whole population , 2004 London HM Treasury

8          Burke-Garcia A, Scally G. Trending now: future directions in digital media for the public health sector, J Public Health, 2014, vol. 36 (pg. 527-34)

9          Aspinall PJ. Commentary on ‘Trending now., J Public Health, 2014, vol. 36 (pg. 535-6)

10        Oyebode O. Commentary on trending now: future directions in digital media for the public health sector, J. Public Health, 2014, vol. 36 (pg. 537-8)

11        Santos C. Crossing Borders, 2014 http://crossingborders.dk/the-politics-of-ebola-how-a-virus-turned-into-a-racism-outbreak/

https://doi.org/10.1093/pubmed/fdu093 Published: 26 November 2014
© The Author 2014. Published by Oxford University Press on behalf of Faculty of Public Health. All rights reserved. For permissions, please e-mail: journals.permissions@oup.com

Lots of planets have a North . . .

Stuart Maconie’s splendid examination of England’s North, Pies and Prejudice, is prefaced with an exchange between Rose Tyler and the Doctor from an early episode of Russell T. Davies’s regenerated Dr Who: ‘If you’re an alien, how come you sound like you come from the North’ asks Rose. ‘Lots of planets have a North’ replies the Doctor, in a definitive Mancunian tone.1

Indeed they do, though sometimes the North is the East, or a specific locale, or the poor.

Owen Jones, author of Chavs – The Demonization of the Working Class, recently dismissed the English North–South divide as a myth.2 There is one division that matters, he argued, ‘those who have wealth and power, and those who do not’. If wealth and power are concentrated in the South, the point would seem rather to be that territorial divisions reflect and reinforce socioeconomic ones.

Responding in the New Statesman, James Maxwell pointed to the disproportionate impact on the North of public sector cuts, and to the long-standing disparity in infrastructure investment within the UK.3 London and its surrounding areas, according to IPPR North, receives over 80% of all planned transport spending, and an estimated 15 times greater share of arts and culture funding than other English regions.

Here, the comparison drawn by Bambra et al., in our guest editorial, of England’s North–South divide with that between East and West Germany before and after unification is pertinent.4 The principal causes of the German convergence of mortality have been identified by Vogt and Gampe as availability of health care and increasing pension levels.5 Since the North of England already enjoys health care that appears to be the match of, or superior to that elsewhere in country, this suggests that economic inequality remains the UK’s biggest problem in achieving geographical equality of health, wellbeing and life expectancy.6

This is no surprise to students and practitioners of public health, and has been a central message of reports from Black to Marmot.7 Yet public health debate is still too often focussed on individual behaviour and choice, and public health practice on efforts to influence those, notwithstanding the widespread recognition that those behaviours and choices are powerfully shaped by external factors. Many of these are beyond the influence of public health practitioners or the institutions that have primary responsibility for public health.

In this context, we have taken the opportunity as editors of our first Journal of Public Health issue to revise the categories in which articles are presented. While we recognize the importance of health improvement, health protection and health care services in the study and practice of public health, we also feel the need to reflect the relative importance of approaches at societal and personal levels. To this end, we have restructured the core content according to: In this edition, only four of these categories appear—Behavioural Factors is absent—although we plan to focus on alcohol in the next issue, with articles that will fall under this heading as well as under others. We invite submissions that consider public health with these categories in mind. Other sections, e.g. Chekhov’s Corner, Perspectives, Training & Education, will continue to appear on an ad hoc basis.

  • Wider Determinants of Health (politics, economics, environment)
  • Life Course and Epidemiology (self-explanatory)
  • Behavioural Factors (e.g. tobacco use, alcohol)
  • Interventions (prevention and services)
  • Methods (self-explanatory)

Finally, a small correction to our esteemed predecessors; in his valedictory editorial, Gabriel Leung described us as both as being ‘of Newcastle’.8 In fact, we are both of Durham University while one of us (E.M.) is also Director of Public Health for Newcastle. Either way, we are delighted at the opportunity to steer the journal, and add to it what we hope will be a usefully Northern perspective as well as a global (or even planetary) one.


1          Maconie S., Pies and Prejudice: In Search of the North, 2007 London Ebury Press

2          Jones O. The north-south divide is a myth – and a distraction, Guardian 4 May 2014

3          Maxwell J. Of course there is a north-south divide – and of course it matters, New Statesman 7 May 2014

4          Bambra C, Barr B, Milne E. North and South: addressing the English health divide, J Public Health, 2014, vol. 36 (pg. 183-6)

5          Vogt T, Gampe J. Money or Medicine? The contribution of rising income and improving health care to the East-West German mortality convergence, 2013 Population Association of America: 2014 Annual Meeting (pg. 1-7) Boston

6          Bevan G, Karanikolos M, Exley J, et al., The Four Health Systems of the United Kingdom: How Do They Compare? 2014 London The Health Foundation

7          Marmot M., Fair Society, Healthy Lives: tThe Marmot Review, 2010LondonThe Marmot Review

8          Leung GM. Mission accomplished: over and out, J Public Health, 2014, vol. 36 pg. 1

Journal of Public Health, Volume 36, Issue 2, 1 June 2014, Pages 181–182, https://doi.org/10.1093/pubmed/fdu036 Published: 01 June 2014


© The Author 2014. Published by Oxford University Press on behalf of Faculty of Public Health. All rights reserved. For permissions, please e-mail: journals.permissions@oup.com.