
Although intending to move on from this topic, a couple of things seem worth updating.
The first of these is a likely explanation for the discrepancy in the scale of age-standardised values in the Watkins paper, noted in my previous blog. I am grateful to colleagues at Public Health England for suggesting the possibility that the authors have mistakenly used the 1976 European Standard Population (ESP) rather than the current, 2013 revision. This looks plausible, although the difference is surprisingly large. Here is a useful Scottish paper on the change between those versions of the ESP. The newer version reflects more aged populations, shifting the shape of the population pyramid to reflect the changes of recent decades.
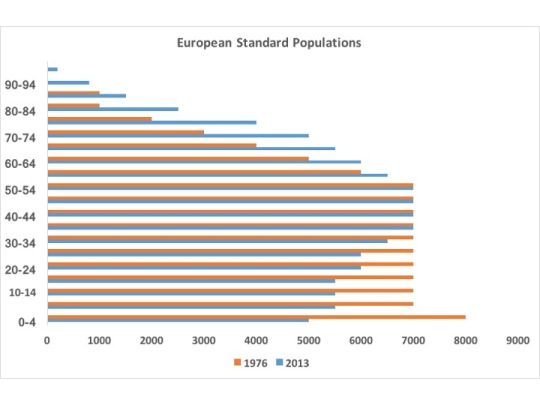
It is difficult to be sure what this does to the rest of the calculations in the paper, but it does not resolve any of the other major problems – for example, that it cannot demonstrate causation, or that it uses an essentially arbitrary selection of data points upon which to base its extrapolations.
Secondly, and for fun, it is worth looking at another major change in social policy associated with a change in the trajectory of life expectancy / mortality from an earlier period.
The NHS commenced on 5th July 1948, with (according to Rudolf Klein’s The Politics of the NHS) a clear expectation that the universal healthcare would improve health and render itself progressively cheaper. We are still waiting for this to happen, and its naïveté survives in the Five Year Forward View‘s perspective on prevention. Here is the graph of life expectancy, based upon data in the Human Mortality Database, for the UK from 1941 to 1951:
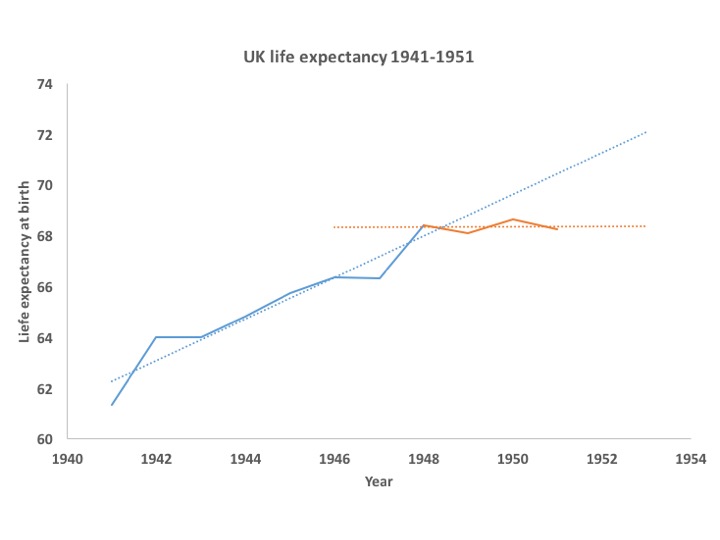 It beggars belief that the arrival of the NHS had a negative effect on health, wellbeing and life expectancy. I don’t believe it and neither, I would guess, do you. On the other hand, this illustrates a key message about the relationship between the provision of care and mortality – it has far less effect than most people, including Watkins et al, think.
In their paper, the factors incorporated as potential mediators of an effect are numbers of doctors, nurses, social care staff and so on (see their supplementary file 3, tables S8-S10), so they are clearly suggesting such provision is causal. Their projection to 2020 implies a shortfall against the otherwise projected increase in life expectancy of about 26% – that is, they suggest it will rise by 1.86 years instead of 2.53 years between 2010 and 2020.
Subjective estimates of the contribution of health care to long term falls in mortality are probably swayed by the triumphs – leukaemia in childhood, for example – and regular press coverage of ‘breakthroughs’. An American study in 2014 demonstrated a public perception that 80% of increased life expectancy was attributable to medical care.
Objective estimates put that figure at less than 20%. Life expectancy rose in the UK by about 30 years during the 20th century, with about 6 of those being the cumulative and acute effects of health care. It is possible, of course, that health care has become more effective in recent years though, again, that is a more marginal effect than most imagine.
Which leads us back to the question of “120,000 deaths” and its plausibility. If the shortfall in funding were to cut 26% from the rate of increase, as proposed, then that would be a larger effect on the trajectory of life expectancy than the entirety of health care impact seen over the last century. It is implausible that so relatively marginal (and I use those words with caution as it is not a small amount of money) an effect on funding could produce so major an impact upon mortality.
Big claims need powerful evidence.
As a final note, while writing this I am also following the Twitter feed of the Lancet Public Health Science Conference (#phsci), it seems apposite to flag the conclusions drawn on complexity by my colleague Harry Rutter at the same conference last year, thus:
- don’t treat complex systems as simple: of course many things appear not to ‘work’; we’re judging them on the wrong criteria;
- linear cause and effect is (relatively) easy to look for, but that doesn’t mean it’s helpful to do so;
- Whole systems approach requires a shift from reductionist, linear, single prespective thinking to transdisciplinary, non-linear systems thinking;
- Don’t forget the lessons of Rose: population level prevention involves shifting the population curve in ways that may be indiscernable at individual level;
- Conceptualise actions as driving perturbations within systems, not as hammers applied to nails;
- Move from ‘does it work’ to ‘does it contribute?’
With some small tweaks, these lessons could usefully have been applied in this case.

Your two blog posts on the “austerity caused 120,000 deaths” claim are intriguing. Since 2017, has anything been published more formally, looking at the issues you found?
LikeLike